Surveys have always been a go-to for understanding populations, but what happens when people don’t respond? Enter the Proxy Pattern-Mixture Model (PPMM), a brilliant method for tackling the tricky problem of missing data. It’s like this invisible helper in statistics, making sure that the data gaps don’t completely skew the results. Instead of brushing off nonresponse as randomness, the PPMM gives us a sensitivity parameter called “ϕ,” which measures just how likely the missing responses are tied to the actual outcome. That means we’re not just guessing anymore. This model helps us calculate more accurate survey results, even if some people don’t answer.
Transforming Surveys with Selection Models
The PPMM isn’t just a stand-alone tool; it becomes even more powerful when expressed as a selection model. Think of it like leveling up your tools to dig deeper into why some people don’t respond. Selection models help us understand how survey results, like someone’s health score, affect the chances they won’t answer the survey. When you link PPMM to a selection model, it’s like opening up a new window into the dynamics of nonresponse. The odds of missing data are now based on real factors, making the results sharper and more reliable. It’s a game-changer for any research that depends on accurate data.
Real-World Impact of PPMM
Take, for example, the U.S. Census Household Pulse Survey. By using PPMM, researchers can assess mental health impacts during the pandemic, even though not everyone answered. The PPMM shines here by filling in these gaps, showing that people with worse mental health might not answer the survey. So instead of throwing away incomplete data, researchers use this model to estimate the likelihood of nonresponse based on real survey outcomes. This way, the data is more reflective of reality, providing insights that traditional methods would completely miss.
Boundaries of the Model: Why Sensitivity Matters
However, as amazing as the PPMM is, there’s a catch. The sensitivity parameter “ϕ” must be chosen wisely. Set it too high, and you might end up with wild, unrealistic guesses about why people aren’t responding. On the flip side, setting it too low could make you miss important patterns. But by linking it to the odds of response through a selection model, researchers can create realistic boundaries. This transforms survey analysis from a shot in the dark to a precision-driven process. Understanding these boundaries is key to using the PPMM to its full potential.
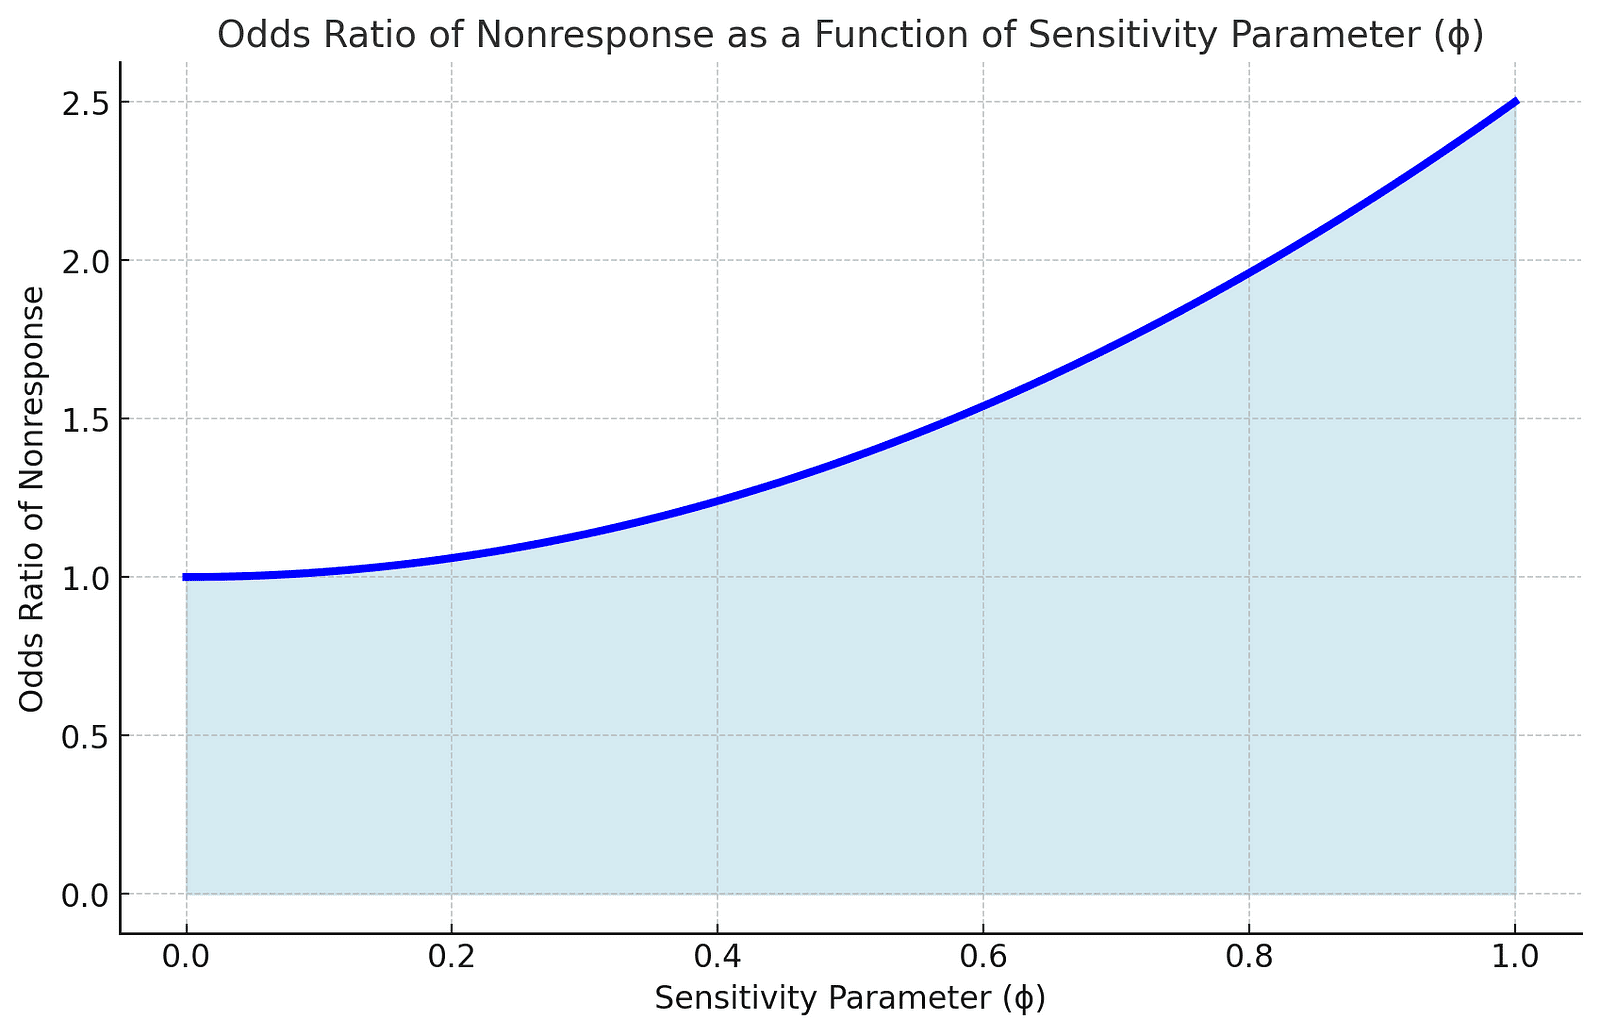
To better understand how the sensitivity parameter ϕ affects the odds of nonresponse, take a look at the graph below, which illustrates how the odds ratio of nonresponse increases as the sensitivity parameter grows.

Why Nonresponse is a Big Deal
When people don’t answer surveys, the missing data can distort the entire picture. A small percentage of nonrespondents can lead to conclusions that aren’t truly representative of the population. Surveys without proper adjustments can overestimate or underestimate key findings, such as health trends or political opinions.
The Role of ϕ: The Game-Changer
The sensitivity parameter ϕ is like a dial you can turn to test different assumptions about missing data. Its range, from 0 to 1, helps researchers explore multiple scenarios and adjust for bias, providing better, more trustworthy insights compared to traditional methods.
The Odds Ratio Twist
Selection models help explain nonresponse by using odds ratios. These ratios show how changes in survey answers, like a health score, affect the likelihood of missing data. With weak proxies, the odds ratios can skyrocket, showing how drastically nonresponse can shape the outcome.
Real Surveys, Real Impact
When applied to the U.S. Census Household Pulse Survey, the PPMM uncovered that individuals with worse mental health were less likely to answer. This insight is vital for creating a full, accurate picture of public health trends, especially during crises like the pandemic.
Boundaries Prevent Overconfidence
ϕ values near 1 can give unrealistic results, exaggerating the effect of nonresponse. Setting reasonable boundaries helps avoid overconfidence in the findings, ensuring that the results remain grounded in reality while still accounting for missing data.
Shaping the Future of Data Collection
The impact of PPMM on data science is profound. This model isn’t just about filling in blanks — it’s about reshaping how we understand and interpret information. By addressing nonresponse bias, we can ensure that surveys represent real-world conditions more accurately, inspiring better decision-making in everything from public health to market research. With continued advancements, the PPMM might just be the tool that ensures no voice goes unheard, even when some people stay silent. The future of data is looking more inclusive and precise than ever.
About Disruptive Concepts
Welcome to @Disruptive Concepts — your crystal ball into the future of technology. 🚀 Subscribe for new insight videos every Saturday!
See us on https://twitter.com/DisruptConcept
Read us on https://medium.com/@disruptiveconcepts
Enjoy us at https://www.disruptive-concepts.com
Whitepapers for you at: https://disruptiveconcepts.gumroad.com/l/emjml


