In our bustling world, traffic is more than just a daily inconvenience; it’s a significant contributor to air pollution. But what if I told you that mathematics, specifically multi-objective optimization, holds the key to untangling this mess? The recent study “Speed Limits in Traffic Emission Models Using Multi-Objective Optimization” dives into this complex issue.
Navigating the Traffic Jam of Pollution
Every day, millions of vehicles hit the roads, each emitting pollutants that harm our environment and health. Traditional solutions have often been a trade-off between reducing traffic congestion and cutting down emissions. Enter the realm of multi-objective optimization, a mathematical superhero in this scenario.
What is Multi-Objective Optimization?
Think of multi-objective optimization as a master chess player, calculating multiple moves ahead. It’s a method used in mathematics to find the best solutions when facing several conflicting objectives. In traffic management, these objectives could be reducing travel time and minimizing emissions simultaneously.
A Mathematical Approach
The study takes a deep dive into the heart of urban traffic management. It’s not just about getting you from point A to B quicker; it’s about doing it in a way that’s better for the planet.
The Big Idea
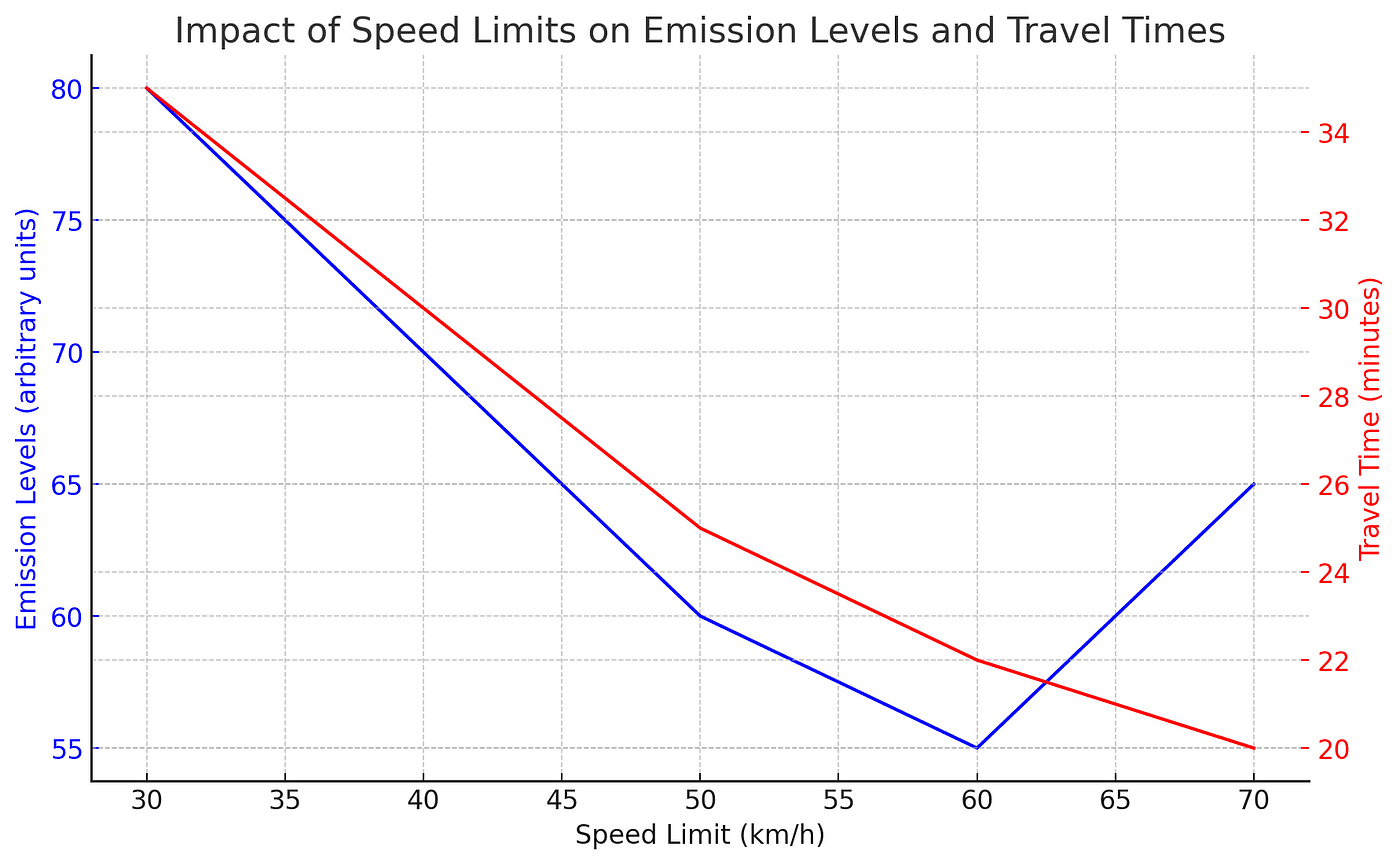
The researchers used mathematical models to simulate traffic flow and emissions under different speed limits. By tweaking these limits, they aimed to find the sweet spot where traffic flows smoothly, and pollution is kept in check.

In the graph above, we visually explore the intricate balance between speed limits, emission levels, and travel times, offering a clearer understanding of how carefully adjusted speed limits can significantly improve both traffic flow and air quality.
The Tools of the Trade
Imagine mathematical equations as spells, each crafted to conjure a clear picture of traffic flow and pollution levels. These ‘spells’ include variables for vehicle speed, the number of cars on the road, and the types of vehicles, each contributing to a complex but solvable puzzle.
Why It Matters to You
As a person in the modern world, you’re inheriting cities bustling with life but struggling with pollution. Understanding and solving these issues isn’t just for politicians and scientists; it’s a challenge for all of us. This study shows how mathematics can be a powerful tool in making our cities cleaner and healthier.
Cleaner Air, Healthier Lives
By optimizing speed limits, we’re not just easing traffic; we’re reducing the smog that clouds our cities. This means clearer skies and a healthier life for you and your future generations.
Mathematics in Action
This study is a perfect example of how the math you learn in school is applied to solve real-world problems. It’s a call to action for young minds like yours to dive into the world of mathematics and make a tangible difference in the world.
A Roadmap for the Future
The study’s findings are more than just numbers on a page; they’re a roadmap for policymakers and city planners. By implementing these optimized speed limits, cities can reduce emissions without creating gridlock.
The Impact
Imagine living in a city where traffic flows like a gentle river instead of a turbulent sea. A city where you can breathe easier, literally and figuratively. That’s the potential impact of applying these mathematical models in real life.
The Challenges Ahead
No solution is without its challenges. Convincing governments and the public to adopt new speed limits requires more than just mathematical proof. It requires a shift in mindset, a recognition that small changes can lead to significant impacts.
The Role of Technology
As technology advances, so do the tools available to tackle these challenges. From smarter cars to more sophisticated traffic management systems, the future of urban travel looks promising.
Your Role in the Equation
This study isn’t just for mathematicians and environmentalists; it’s for every person who’s ever been stuck in traffic or worried about the air they breathe. It’s a call to explore the world of mathematics and its potential to solve the problems we face today.
The road ahead is long, but with studies like this leading the way, and minds like yours ready to take on the challenge, the future looks a little less congested and a lot more breathable.
About Disruptive Concepts
Welcome to @Disruptive Concepts — your crystal ball into the future of technology. 🚀 Subscribe for new insight videos every Saturday!


